Zuzzle – E-learning Platform
client
Zuzzle
–
E-learning
Platform
Zuzzle – E-learning Platform
industry
EdTech
platform
Web Application
5 months
Duration
5 employees
Team
Request
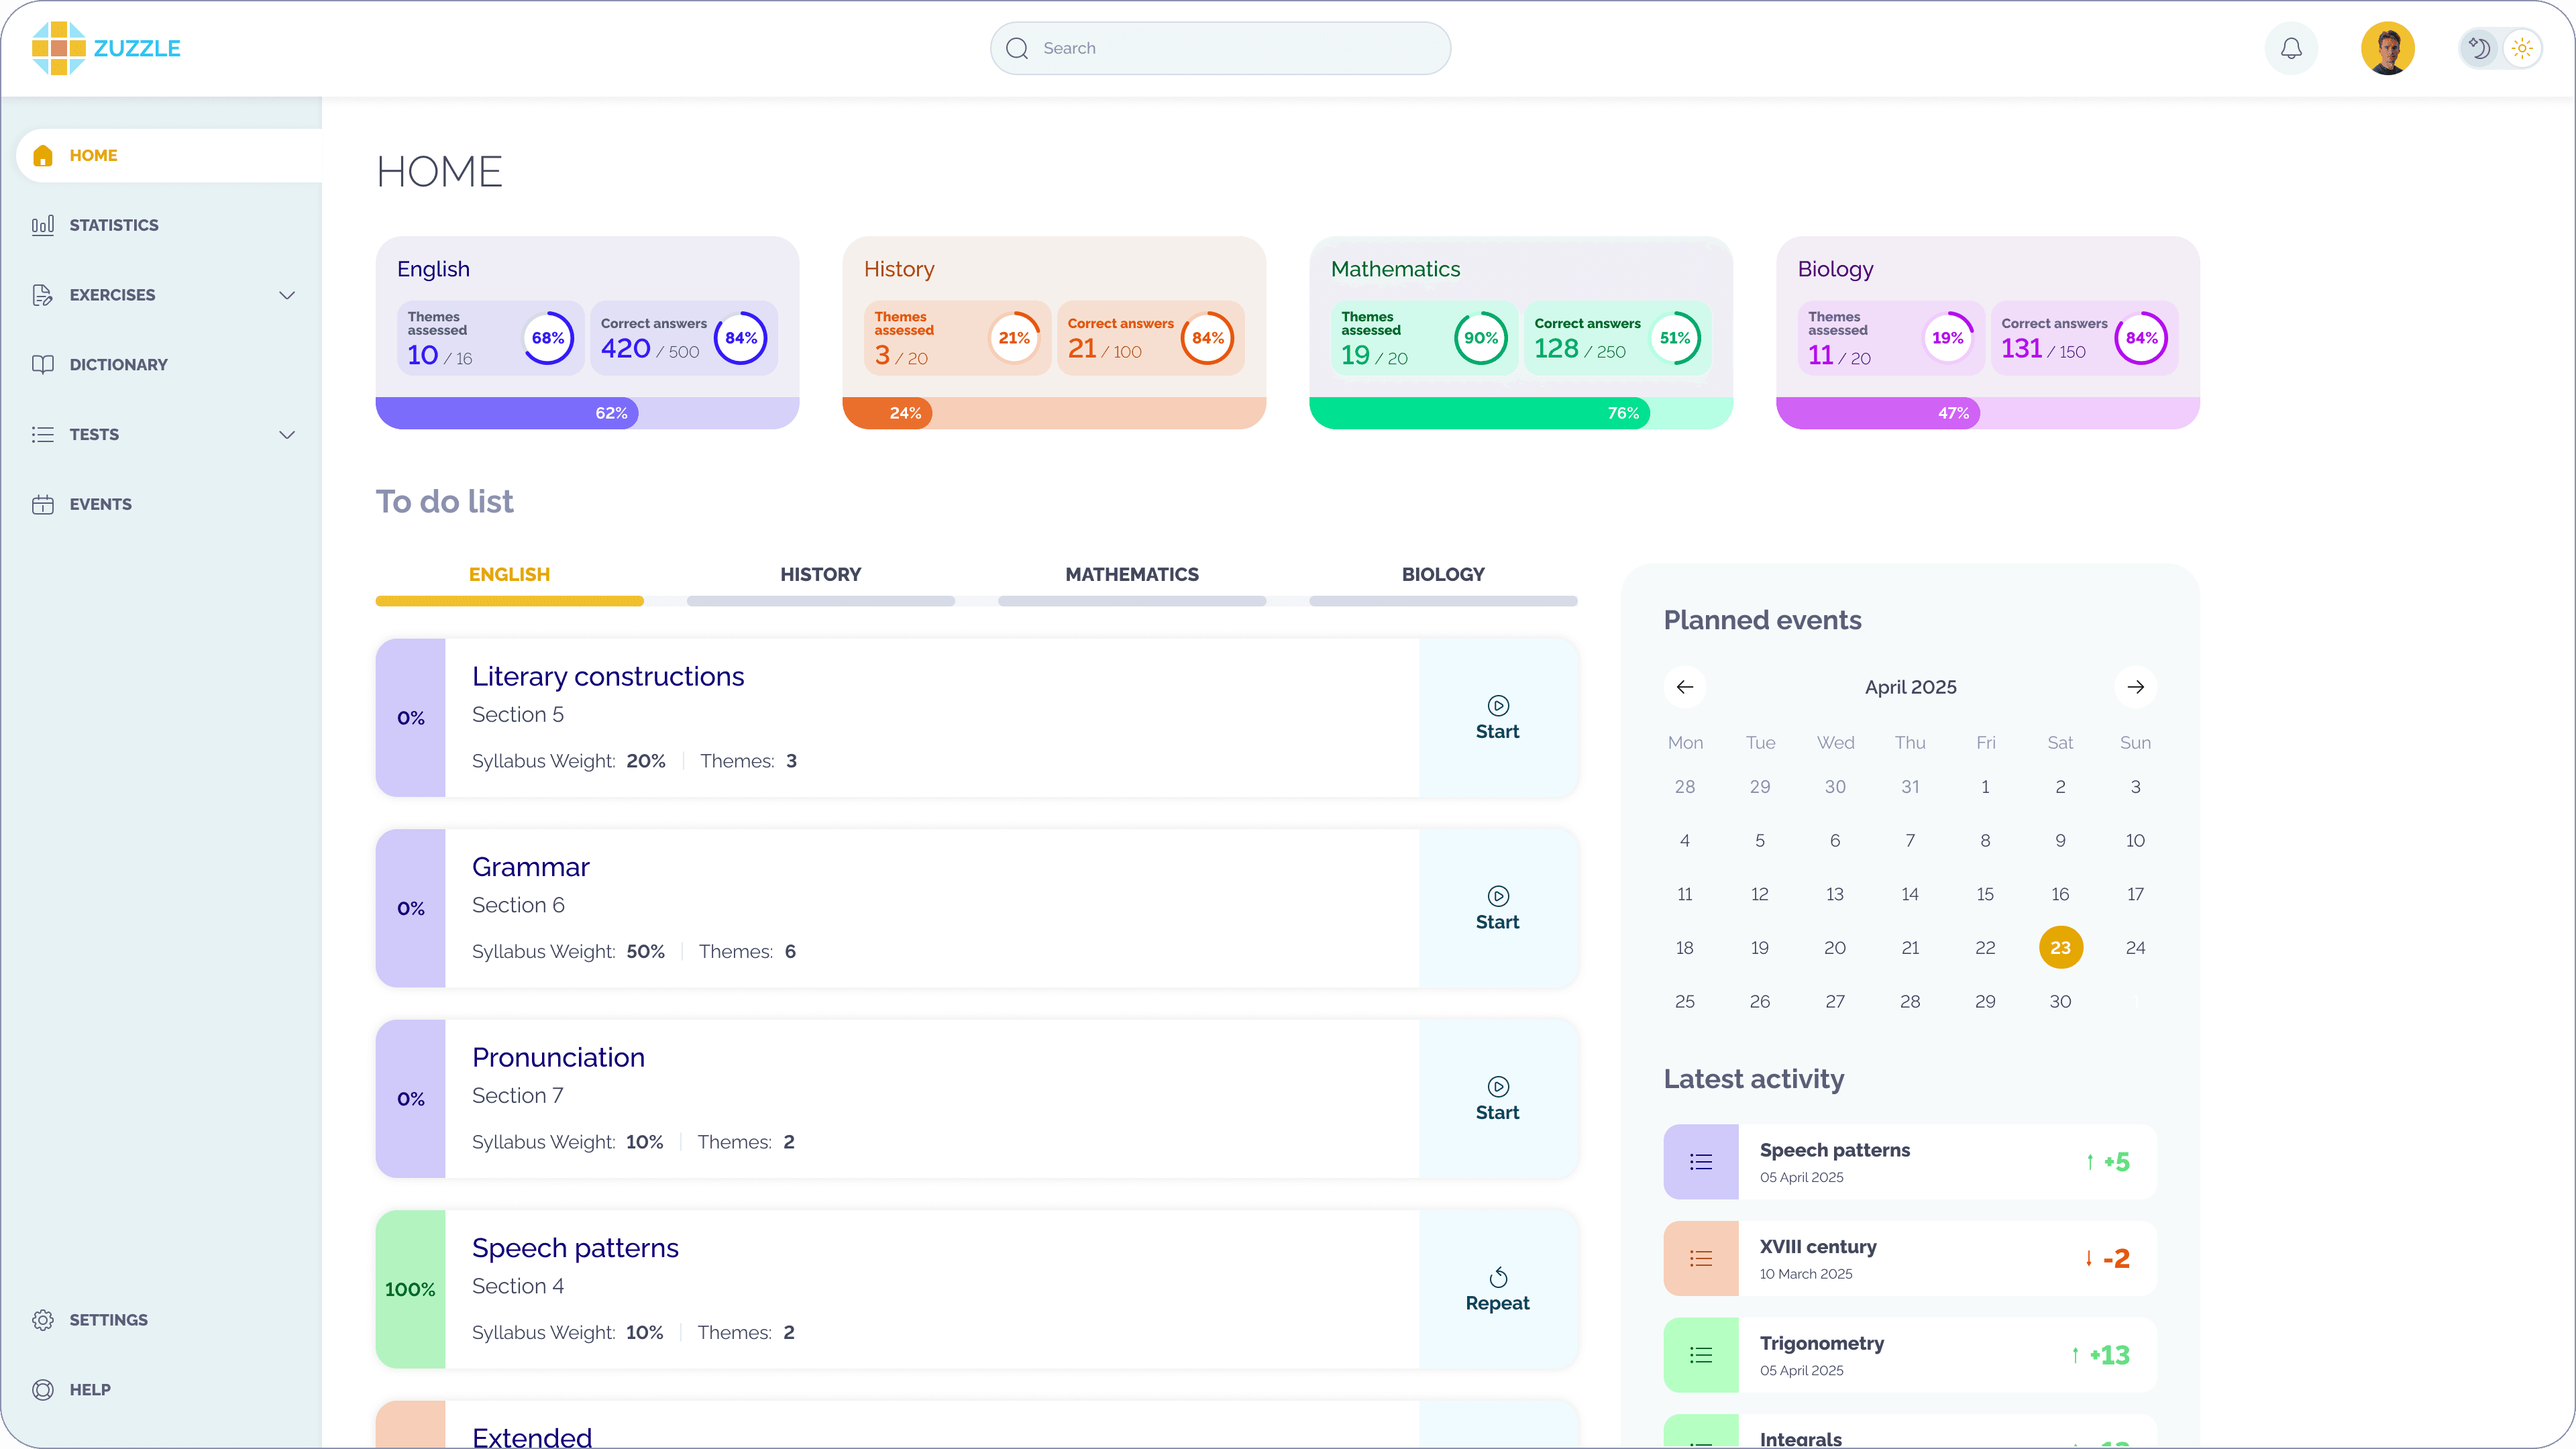
The client requested a learning environment for exam preparation with quantifiable progress. The system should support multiple courses, display intelligible learning statistics, and assist students in organizing and keeping track of their daily study schedules. The platform needed to grow both in terms of users and content. Dashboards had to be useful, readable, and consistent on desktops as well as smartphones.
Challenge
The key difficulty was developing a data model that is consistent and comparable across all disciplines without duplicating logic or breaking analytics. The dashboard must be simple, so students can easily understand and rely on progress data. The interface had to present dense analytics (cards, charts, calendars, and filters) and not overwhelm users, many of whom prepare for exams under pressure. The same learning workflows had to work consistently across devices.
Our solutions
We created a single, cross-disciplinary data model that allows us to add additional courses and topics without rewriting the fundamental logic. Clear progress dashboards and subject-level comparisons become possible with an analytics layer. It transforms unstructured learning activity into organized measurements. To make dense content readable on all screen sizes, we employed a card-based style and purpose-driven charts on the front end.
Our solutions
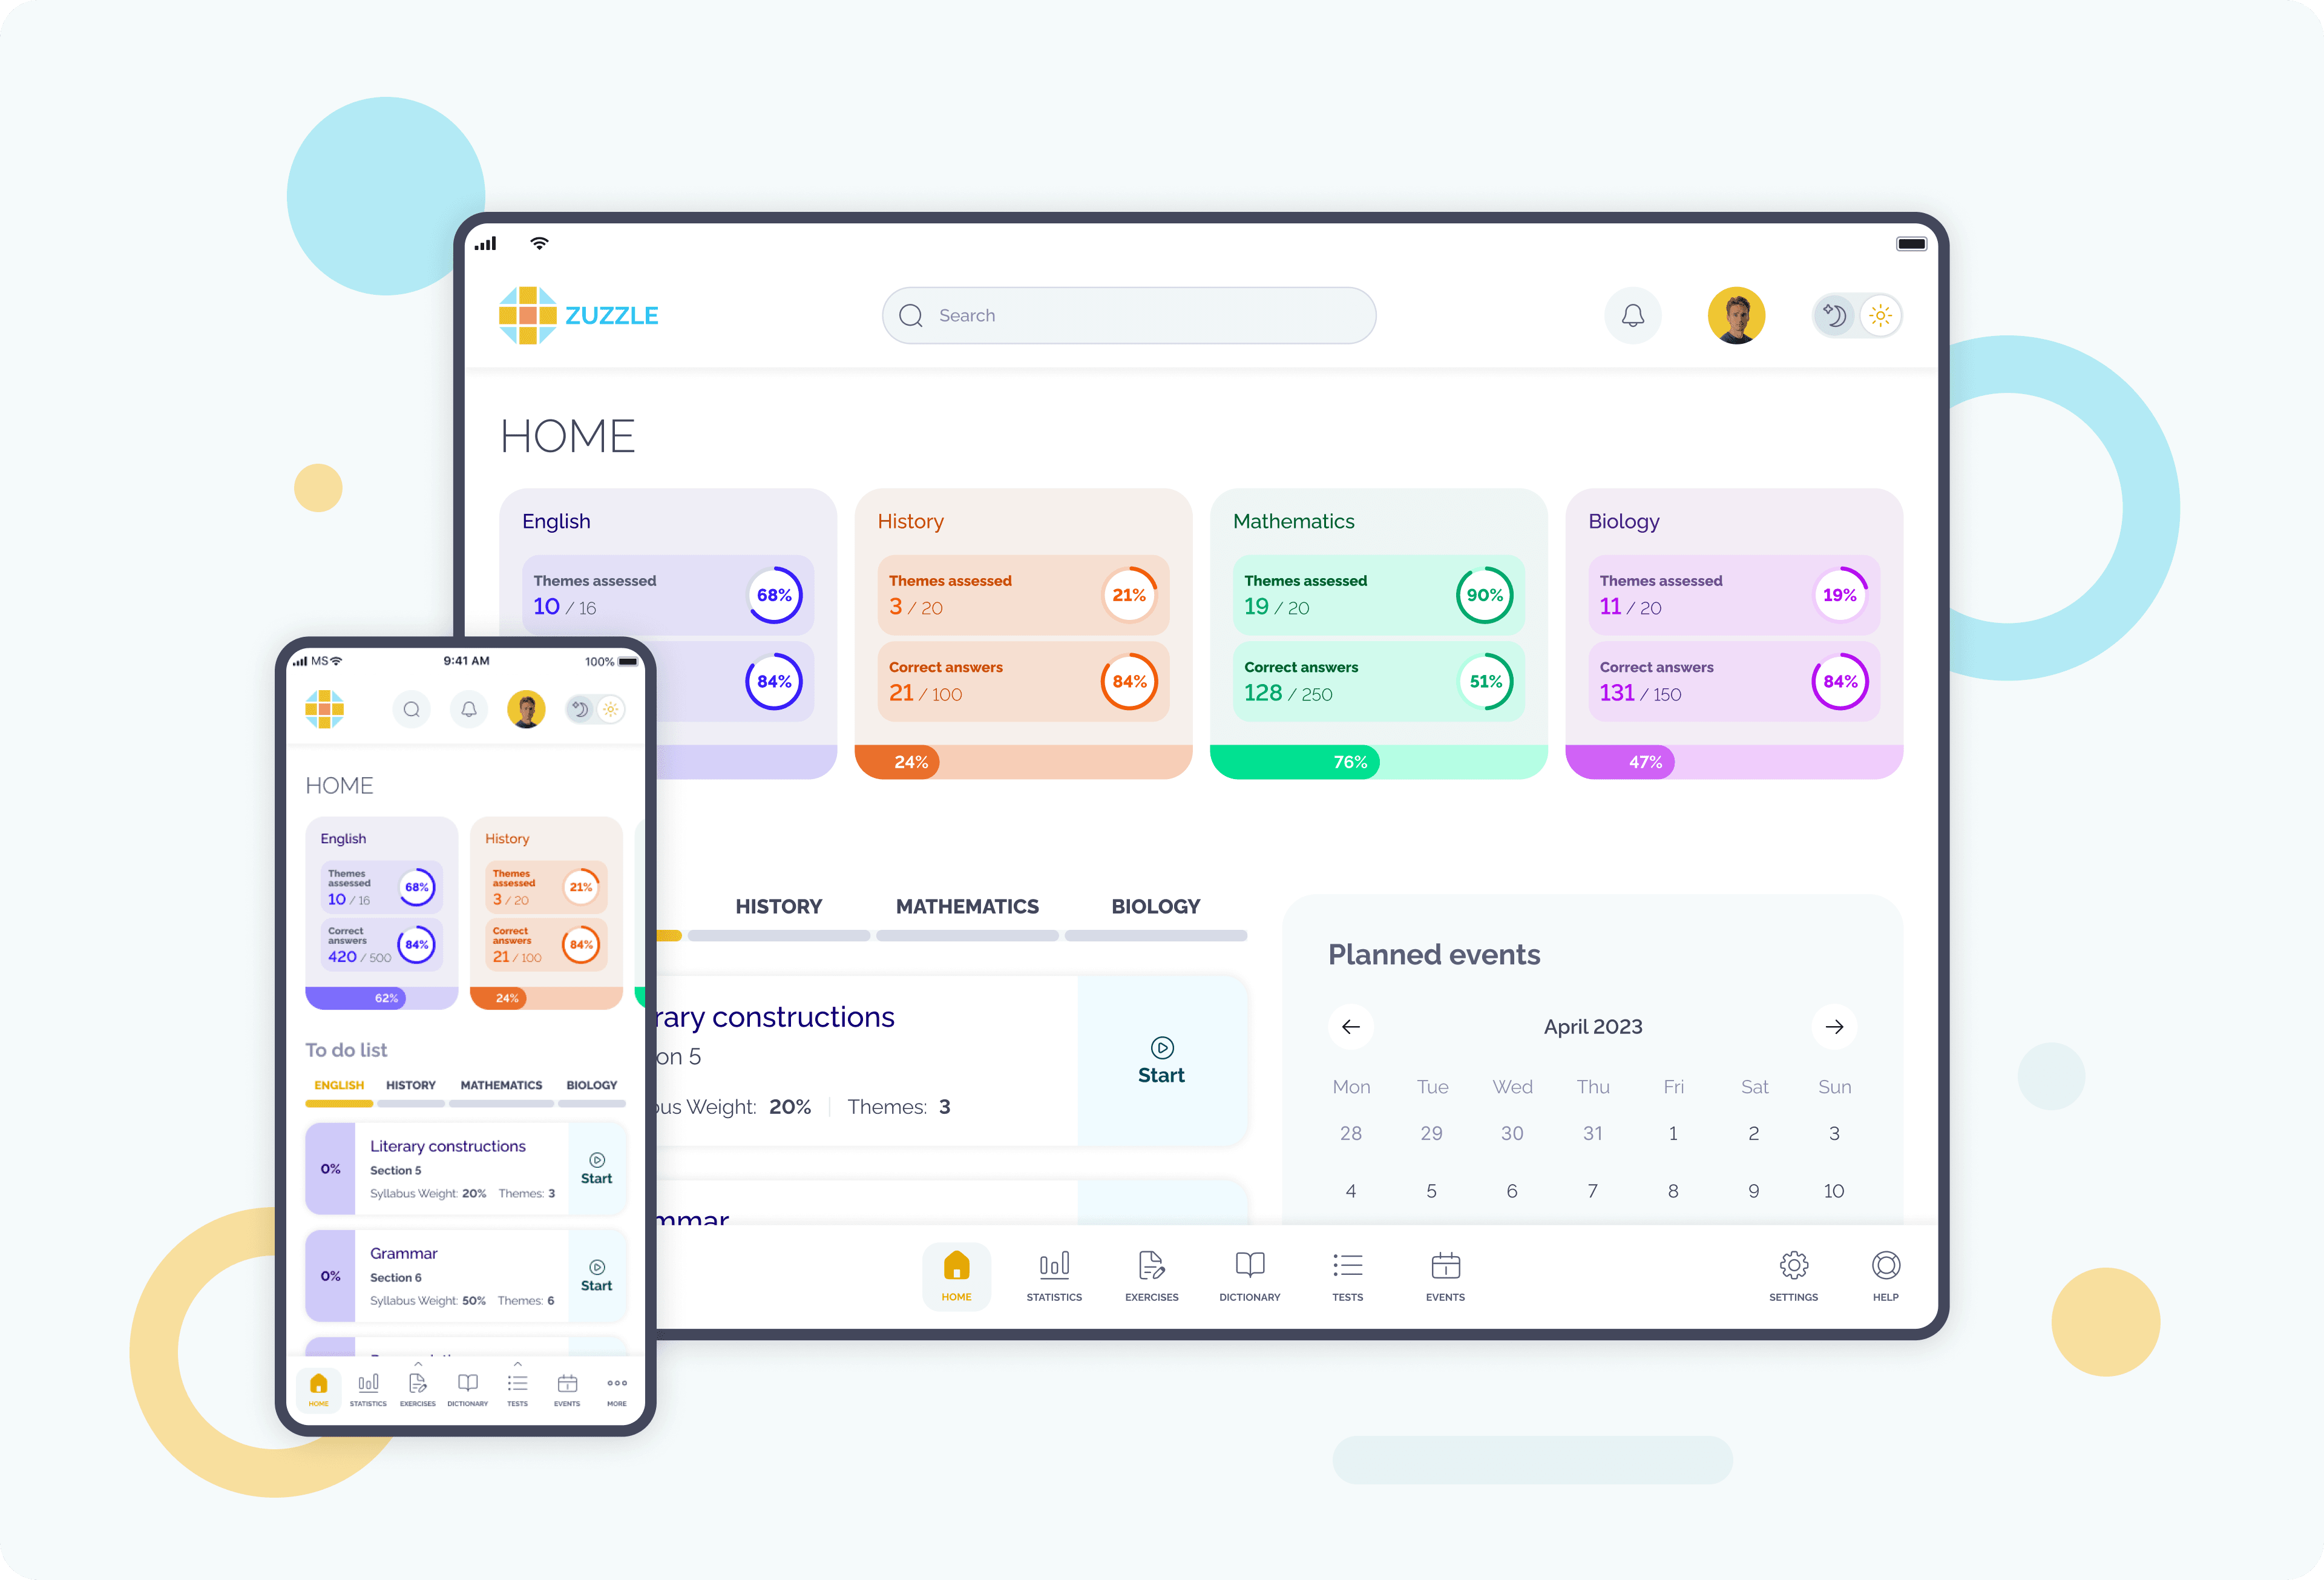
Learning Progress Dashboard
We built the dashboard on a unified analytics layer that aggregates learning data by subject, theme, and time period. Visual components follow a consistent design logic, so charts, progress bars, and summaries update dynamically as new results appear. So, users can instantly see where they are progressing and where they need to focus next.
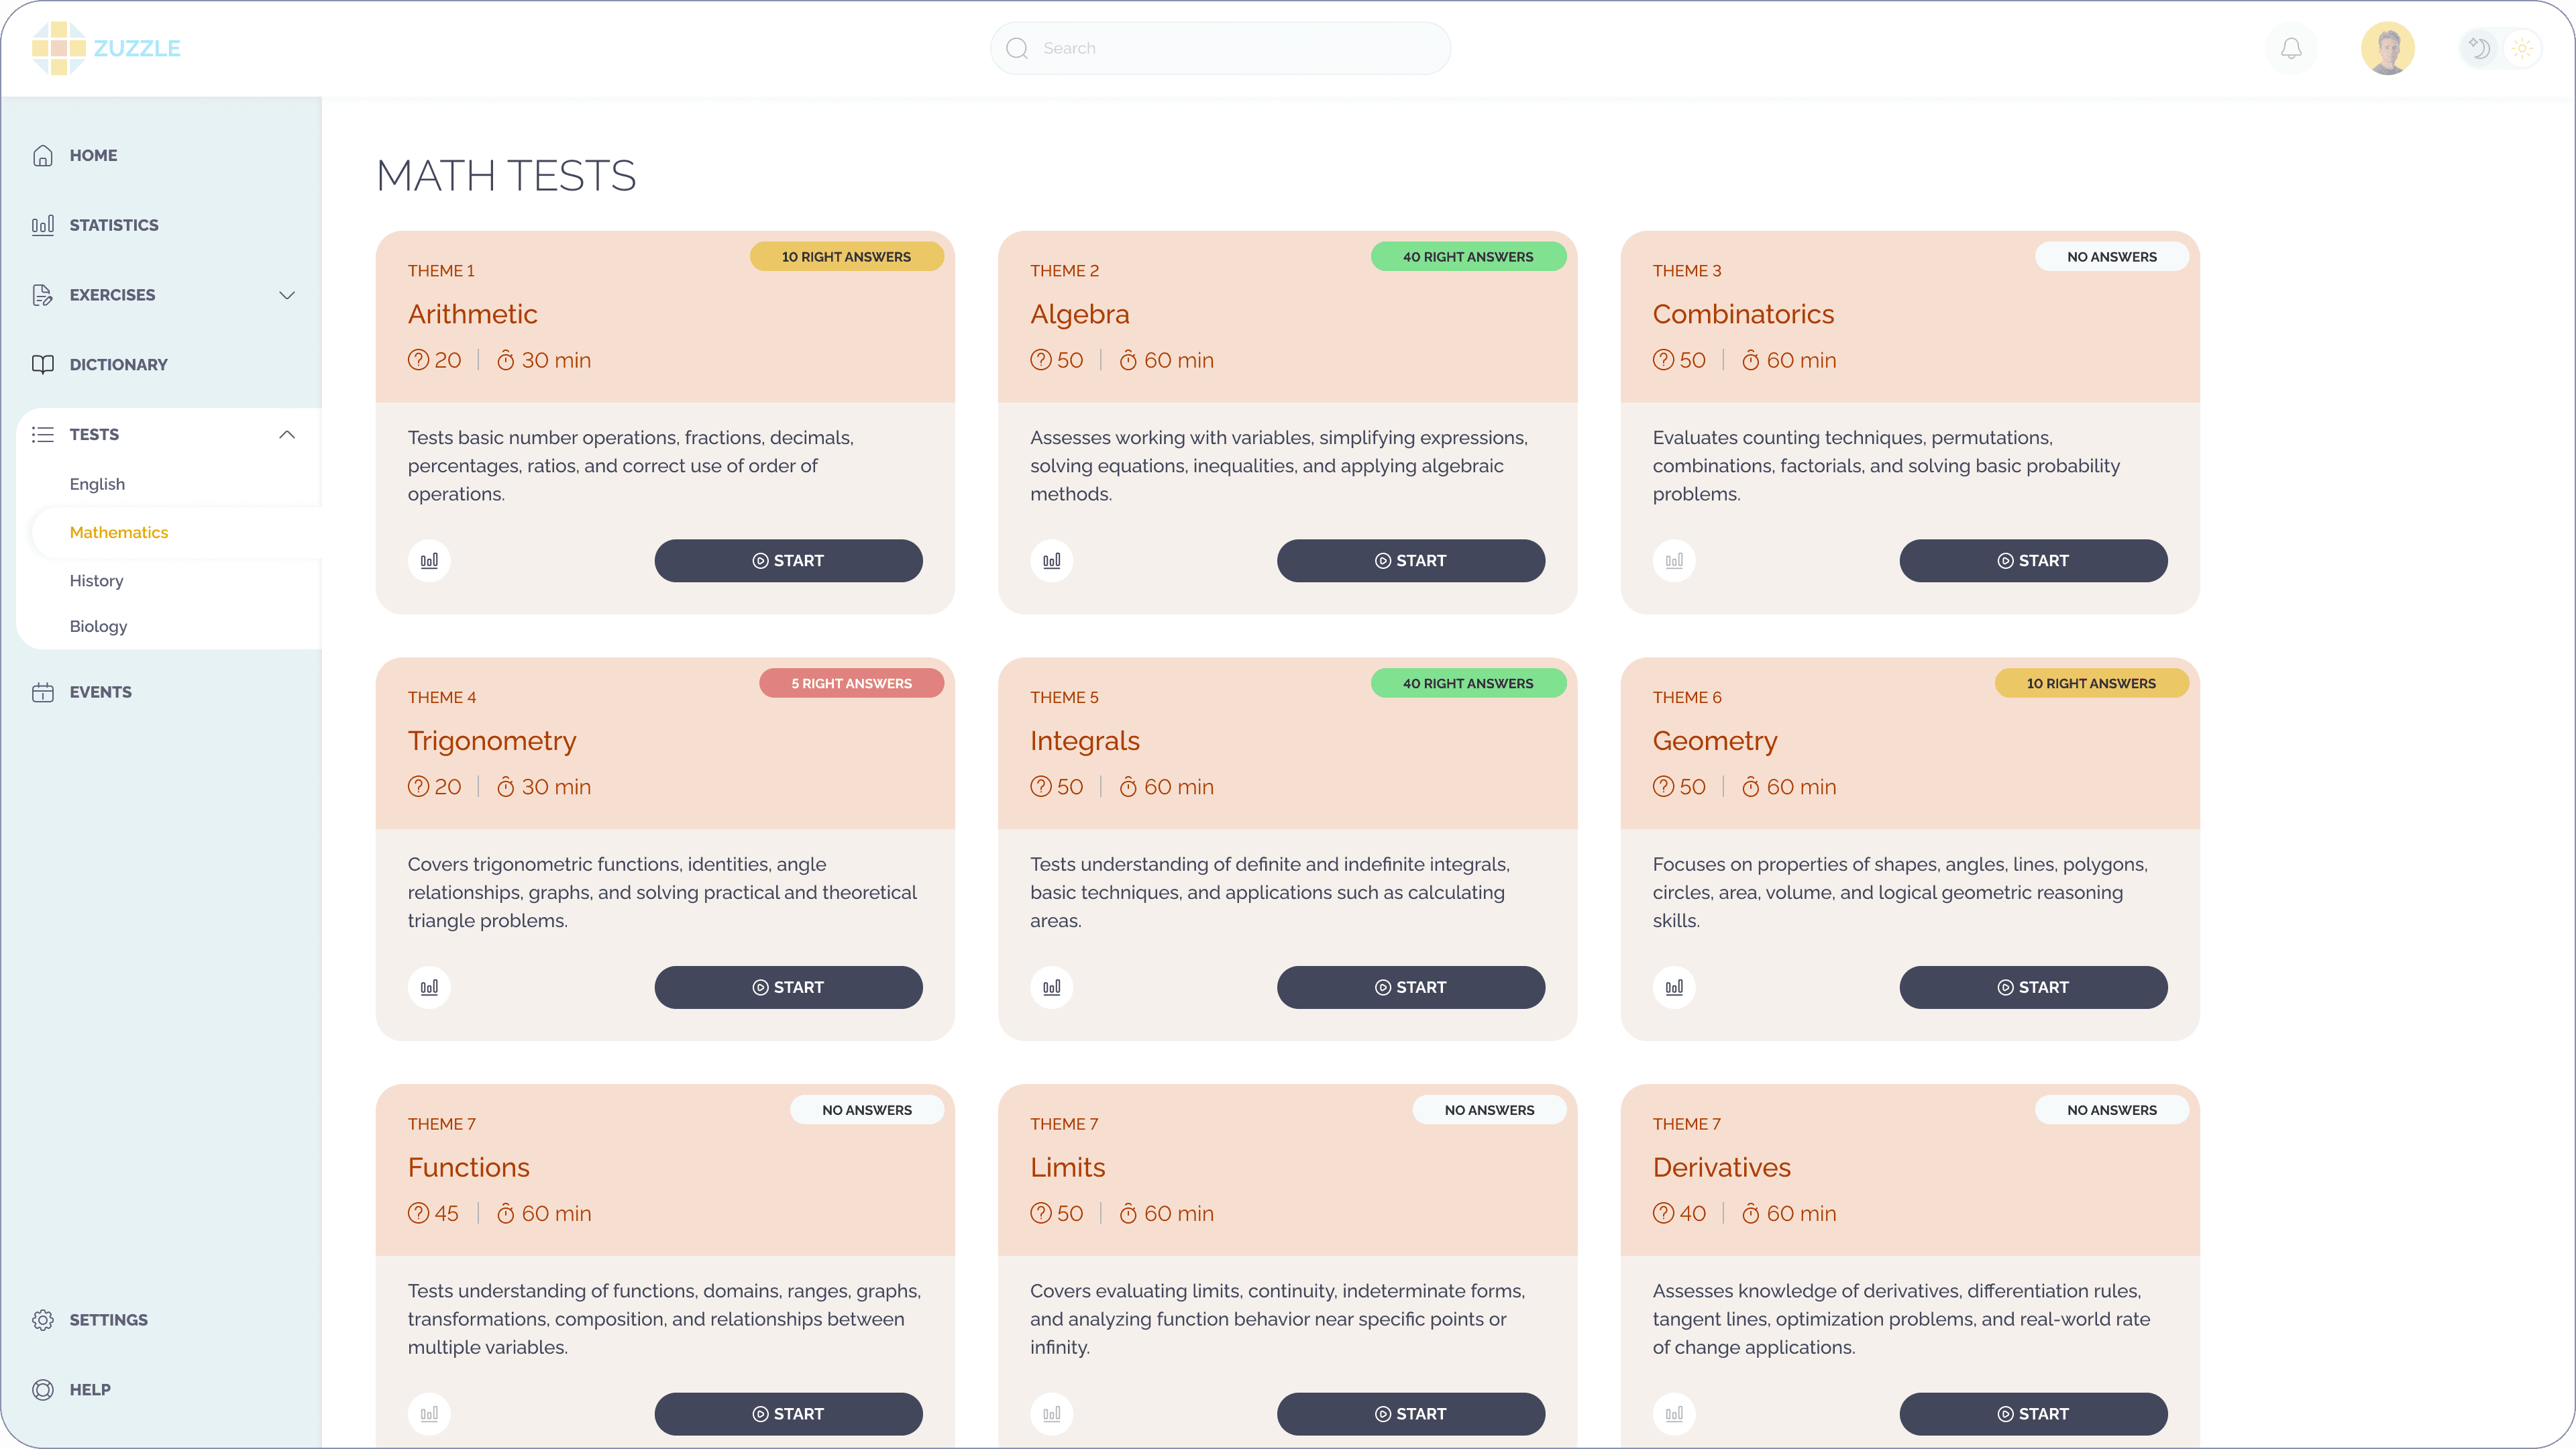
Exam & Test Module
The test engine supports multiple assessment types and stores detailed answer data for each attempt. This allows the system to calculate topic-level performance and show students precise feedback instead of generic scores. We took care of exam preparation to be effective and focus on weaknesses to improve.
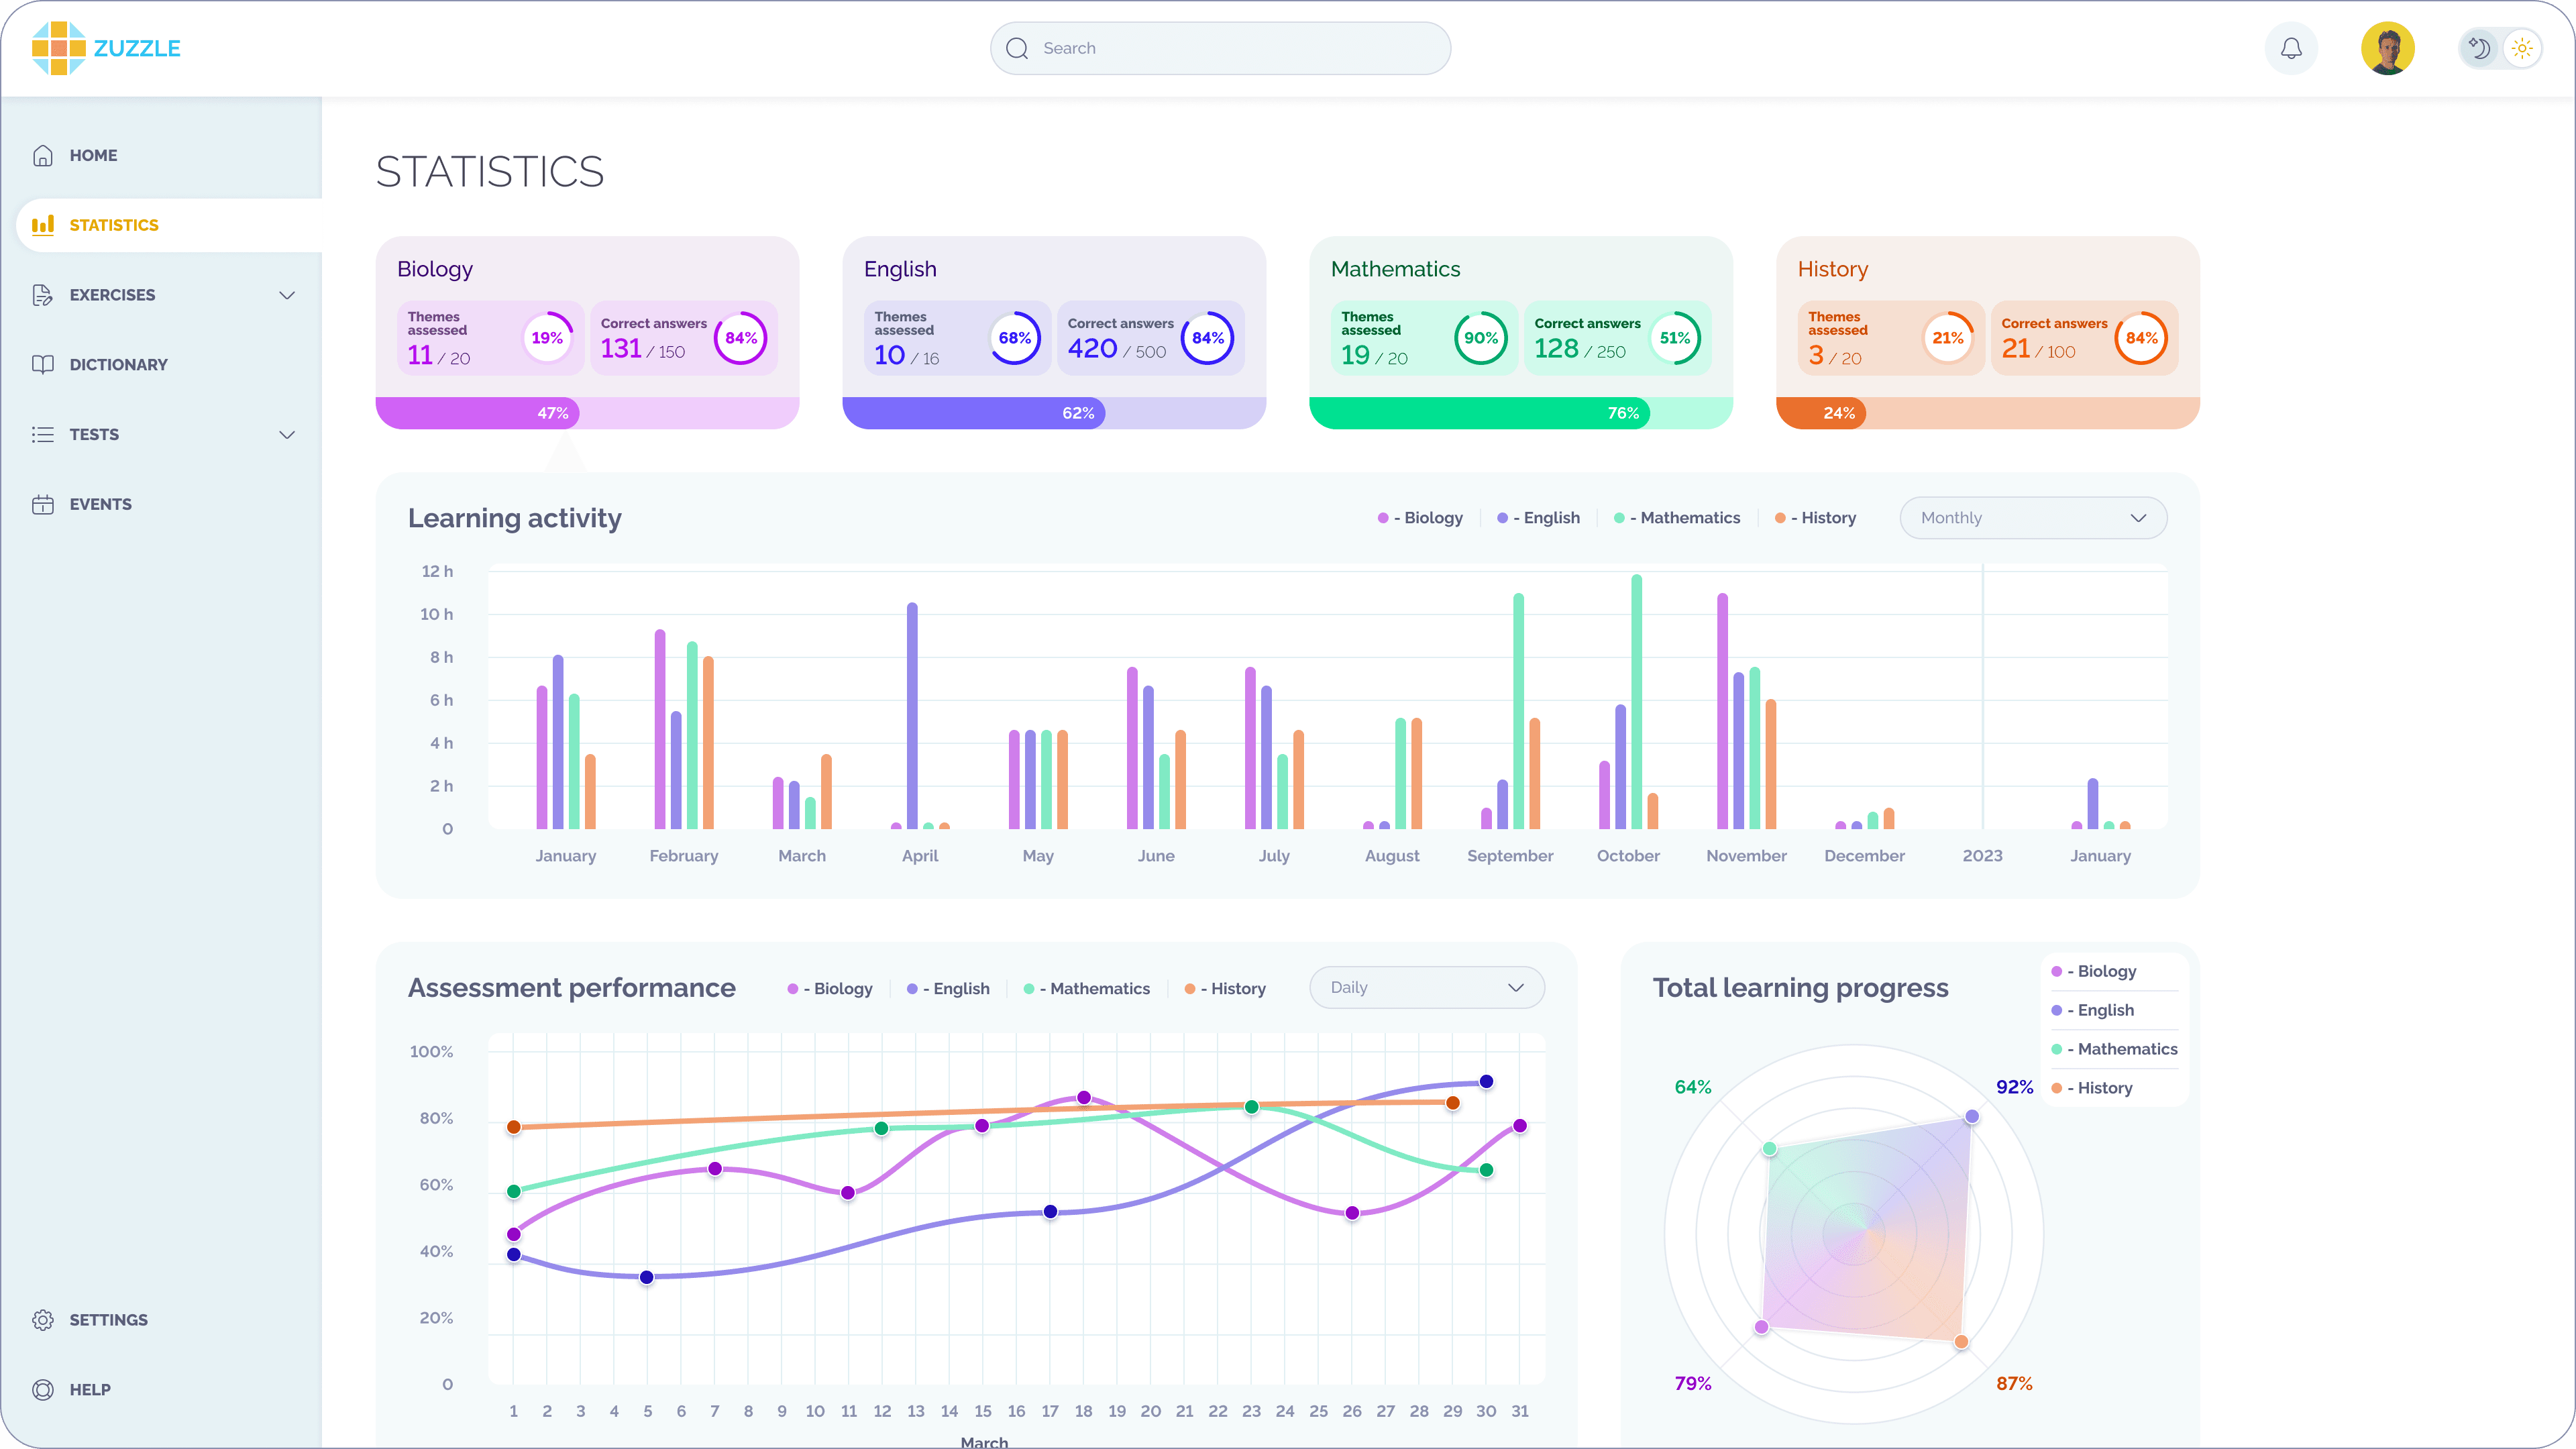
Learning Analytics & Statistics
Analytics are processed as structured metrics rather than raw logs, which keeps calculations stable as user activity grows. We prioritized comparison views and time-based trends in our design to allow consumers to monitor progress patterns. Over time, learning development becomes more observable and interpretable.
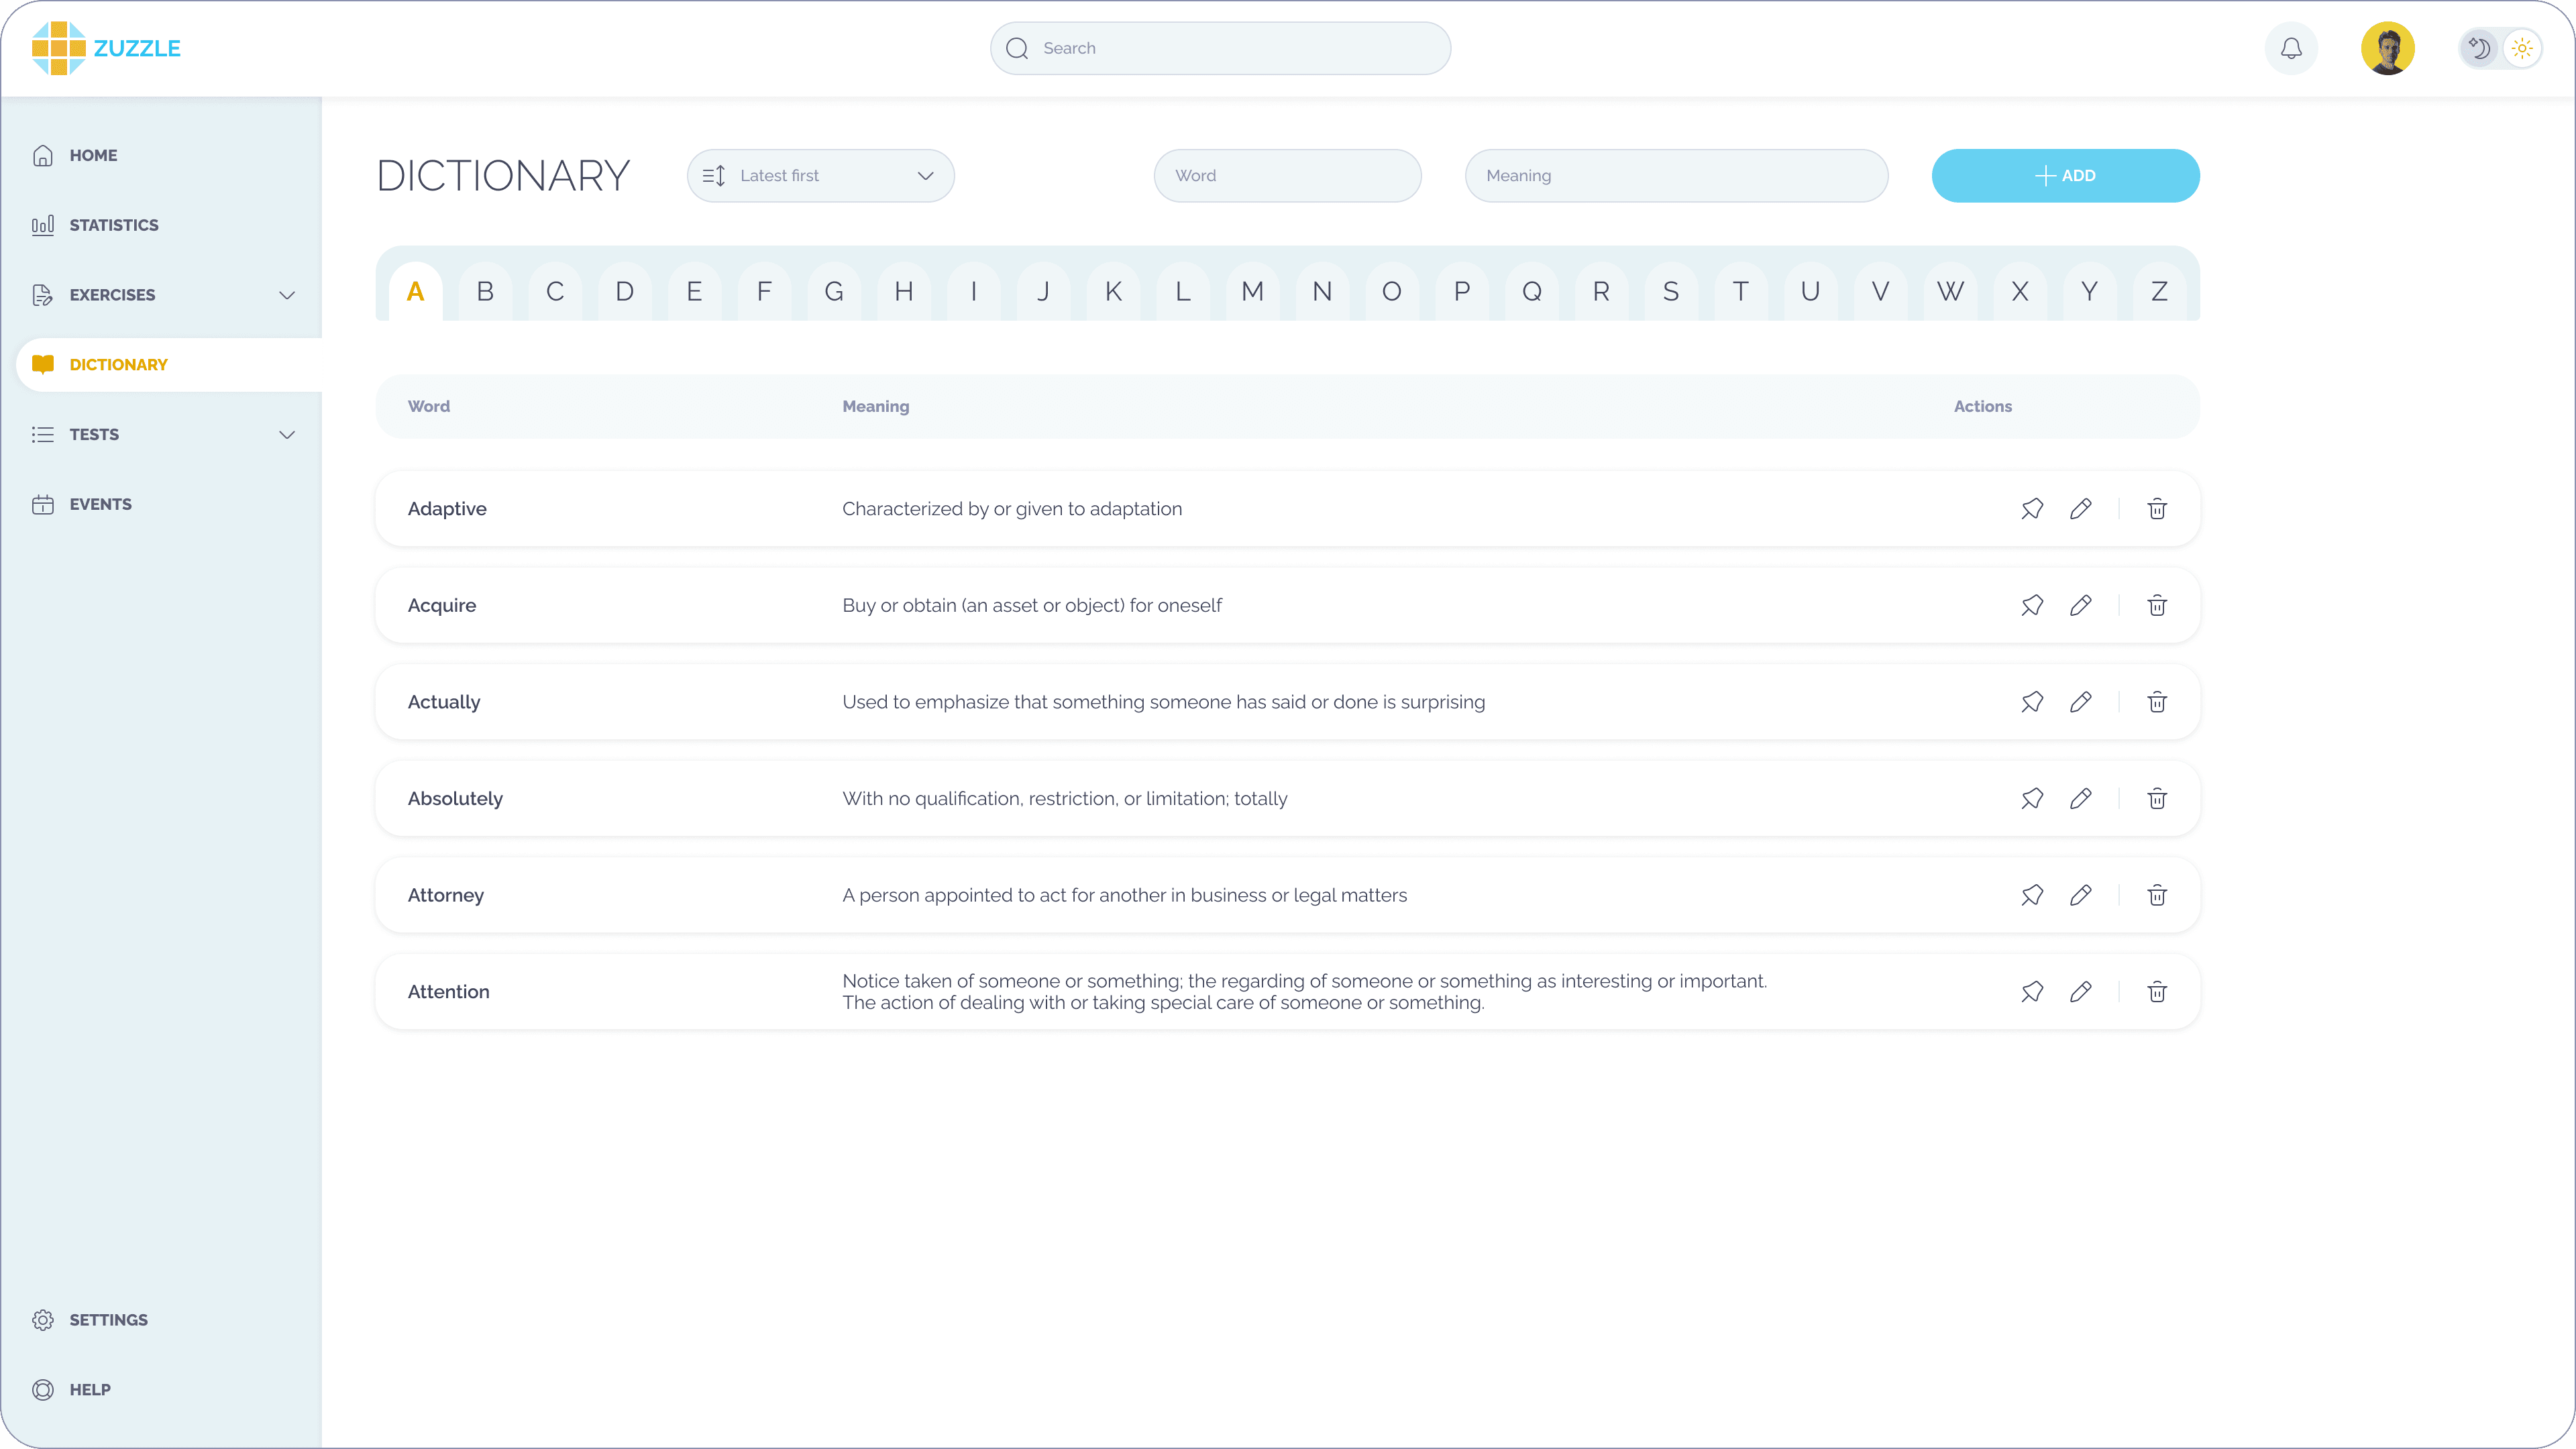
Study Planning & Activity Tracking
The planning module links tasks to progress metrics and aligns planned activities with learning outcomes. Users can manage routines without navigating between different tools thanks to the interface's clear states and visual hierarchy. Study plans are practical and directly connect to goals and results.
Results (MVP stage)
- We built 6 basic learning elements (subjects, themes, tests, exercises, dictionaries, and statistics) within a single data model to eliminate duplication.
- Our team delivered desktop, tablet, and mobile support in the first release without separate versions.
- 36% lower projected cost for feature expansion, as new subjects and exams can be added without changes to core logic or analytics architecture.
- Up to 30% higher weekly retention for exam-focused users, based on the implemented progress tracking and planning mechanics.
Technologies we used


Project team


Similar Cases
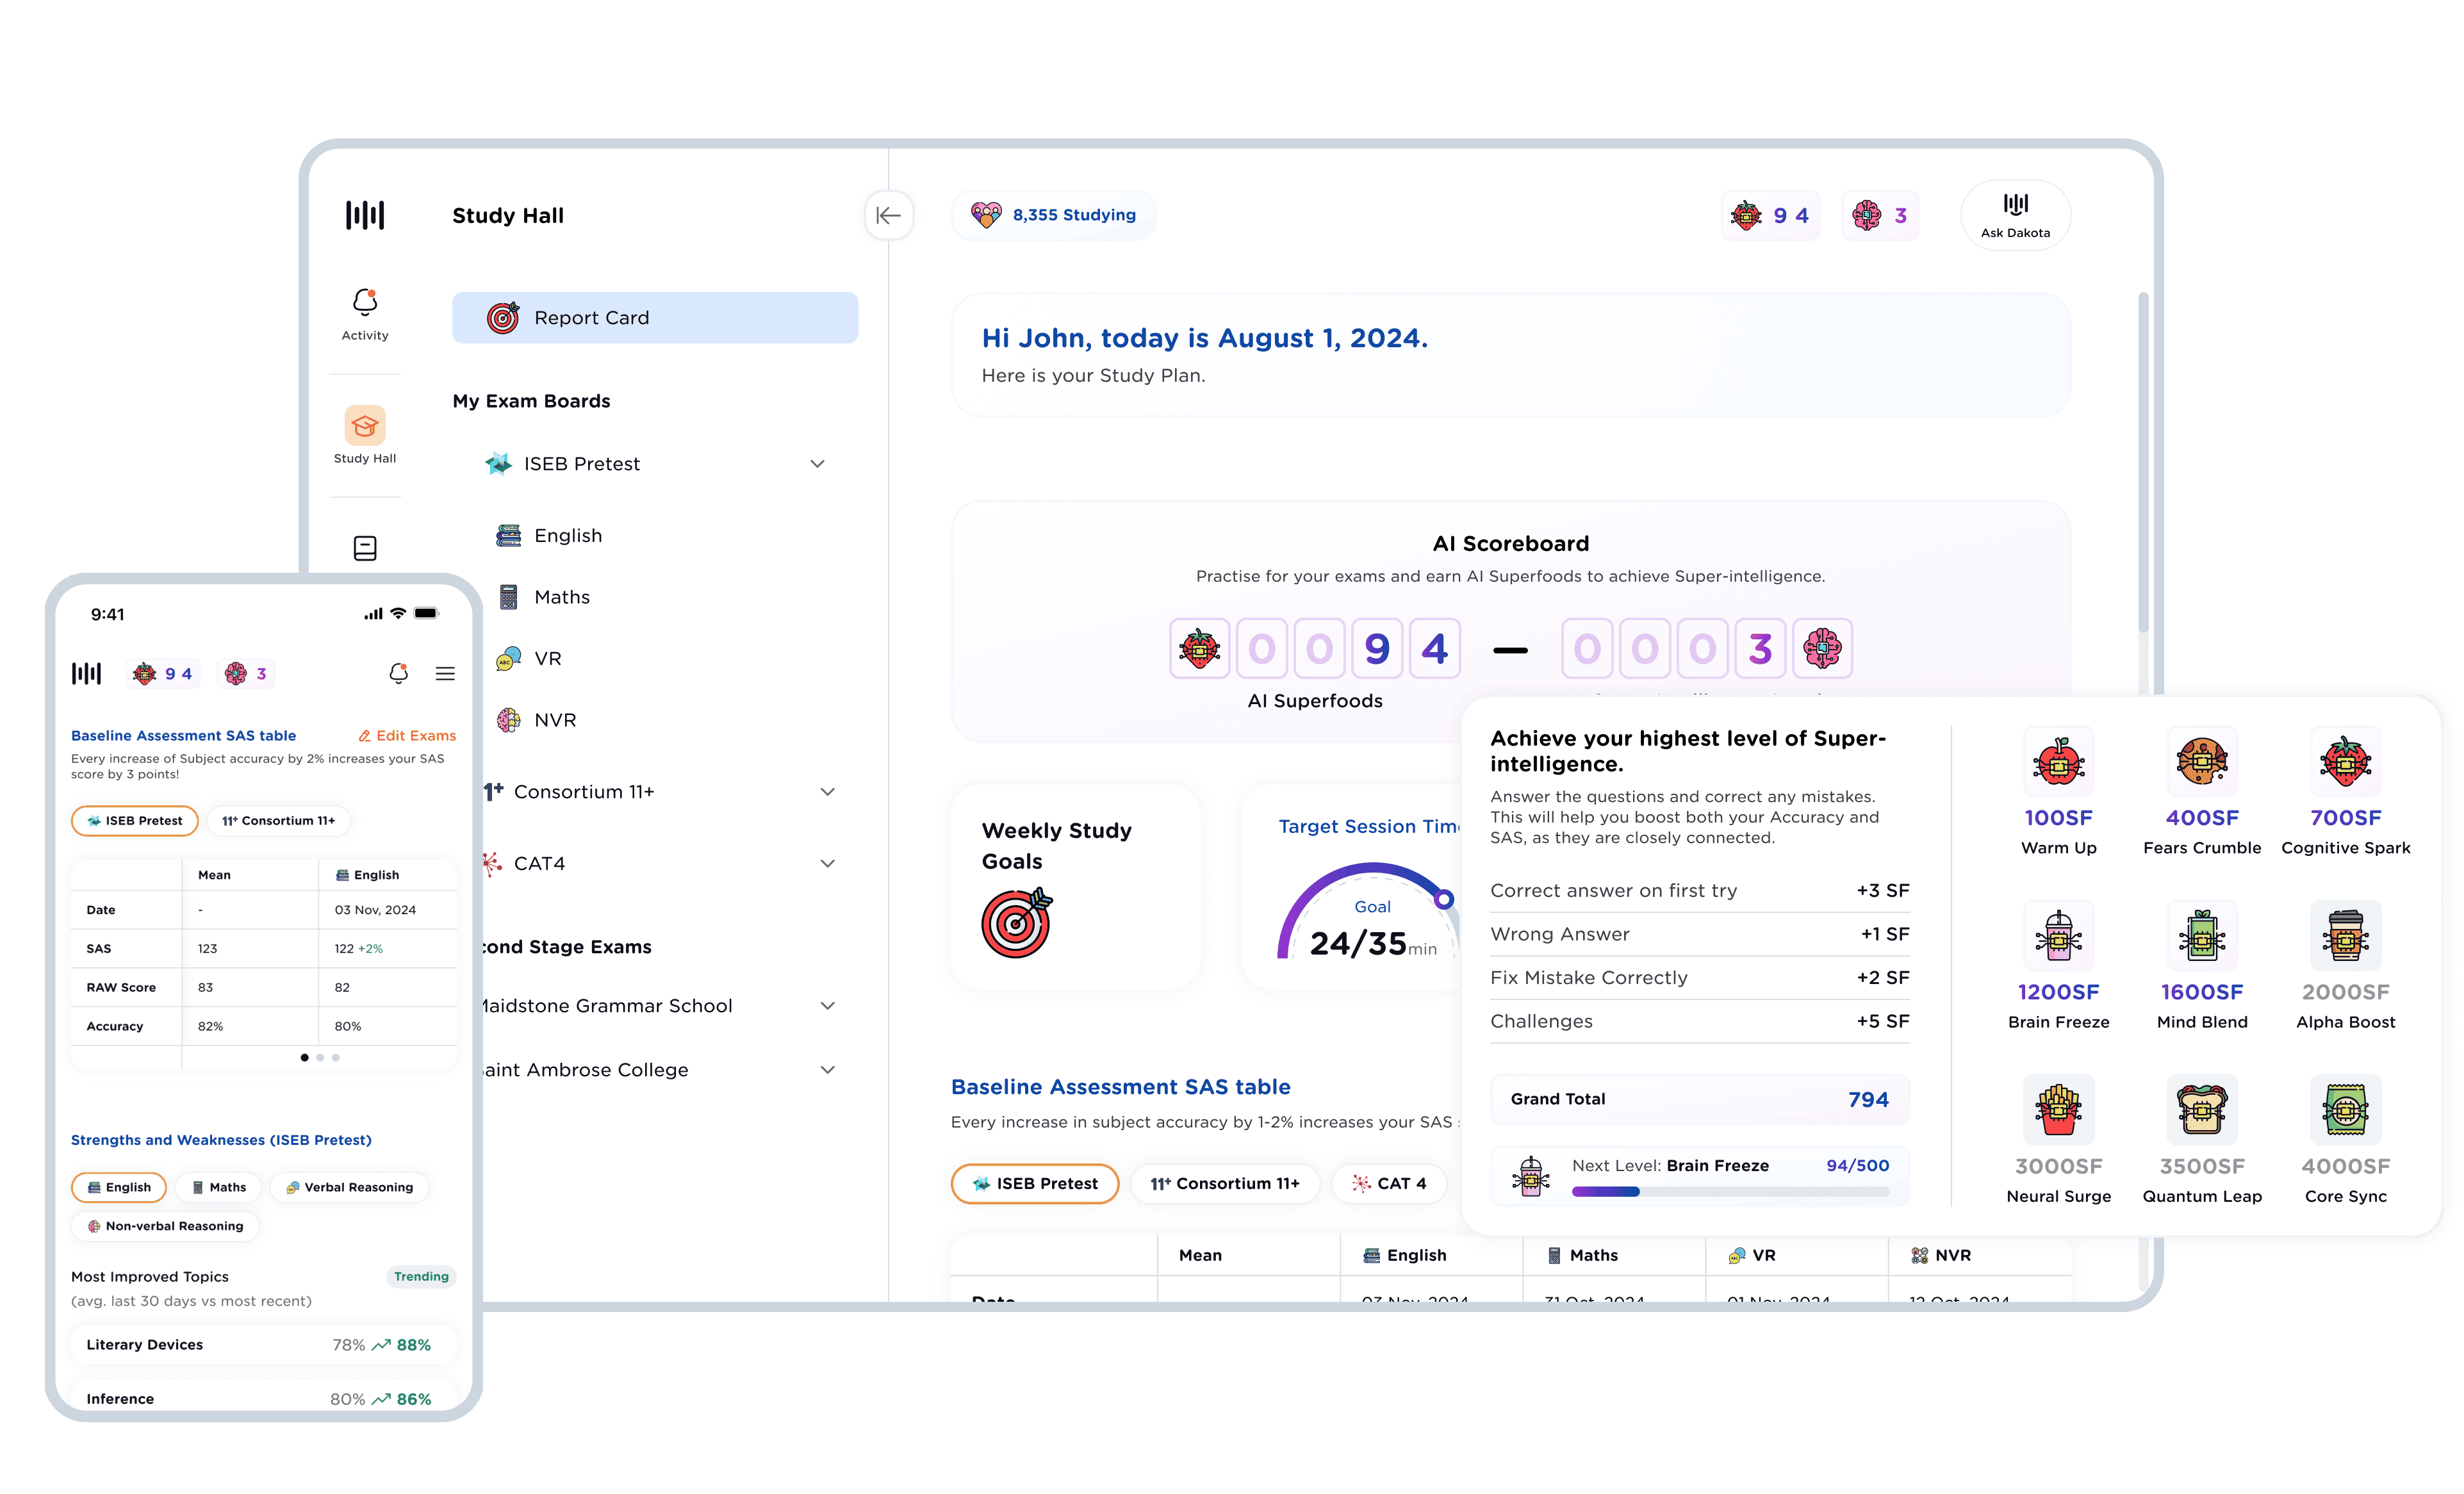
StudyHall - Online platform for teachers and students
StudyHall is a web and mobile learning platform for structured study and exam preparation. It combines AI assistance, grammar practice, and teacher-led assessments to help students work with complex materials more efficiently. Our client got clear tools for educators to track progress and understanding in one system.
View
Infinightly – Smart Social App
Infinightly is a social event management app for modern event creators and attendees. Over 10 months of collaboration, our Yojji’s team transformed the idea into a full-featured social ecosystem where users can effortlessly explore, organize, and manage every stage of their event journey. It also helps reduce event setup time by over 40%.
View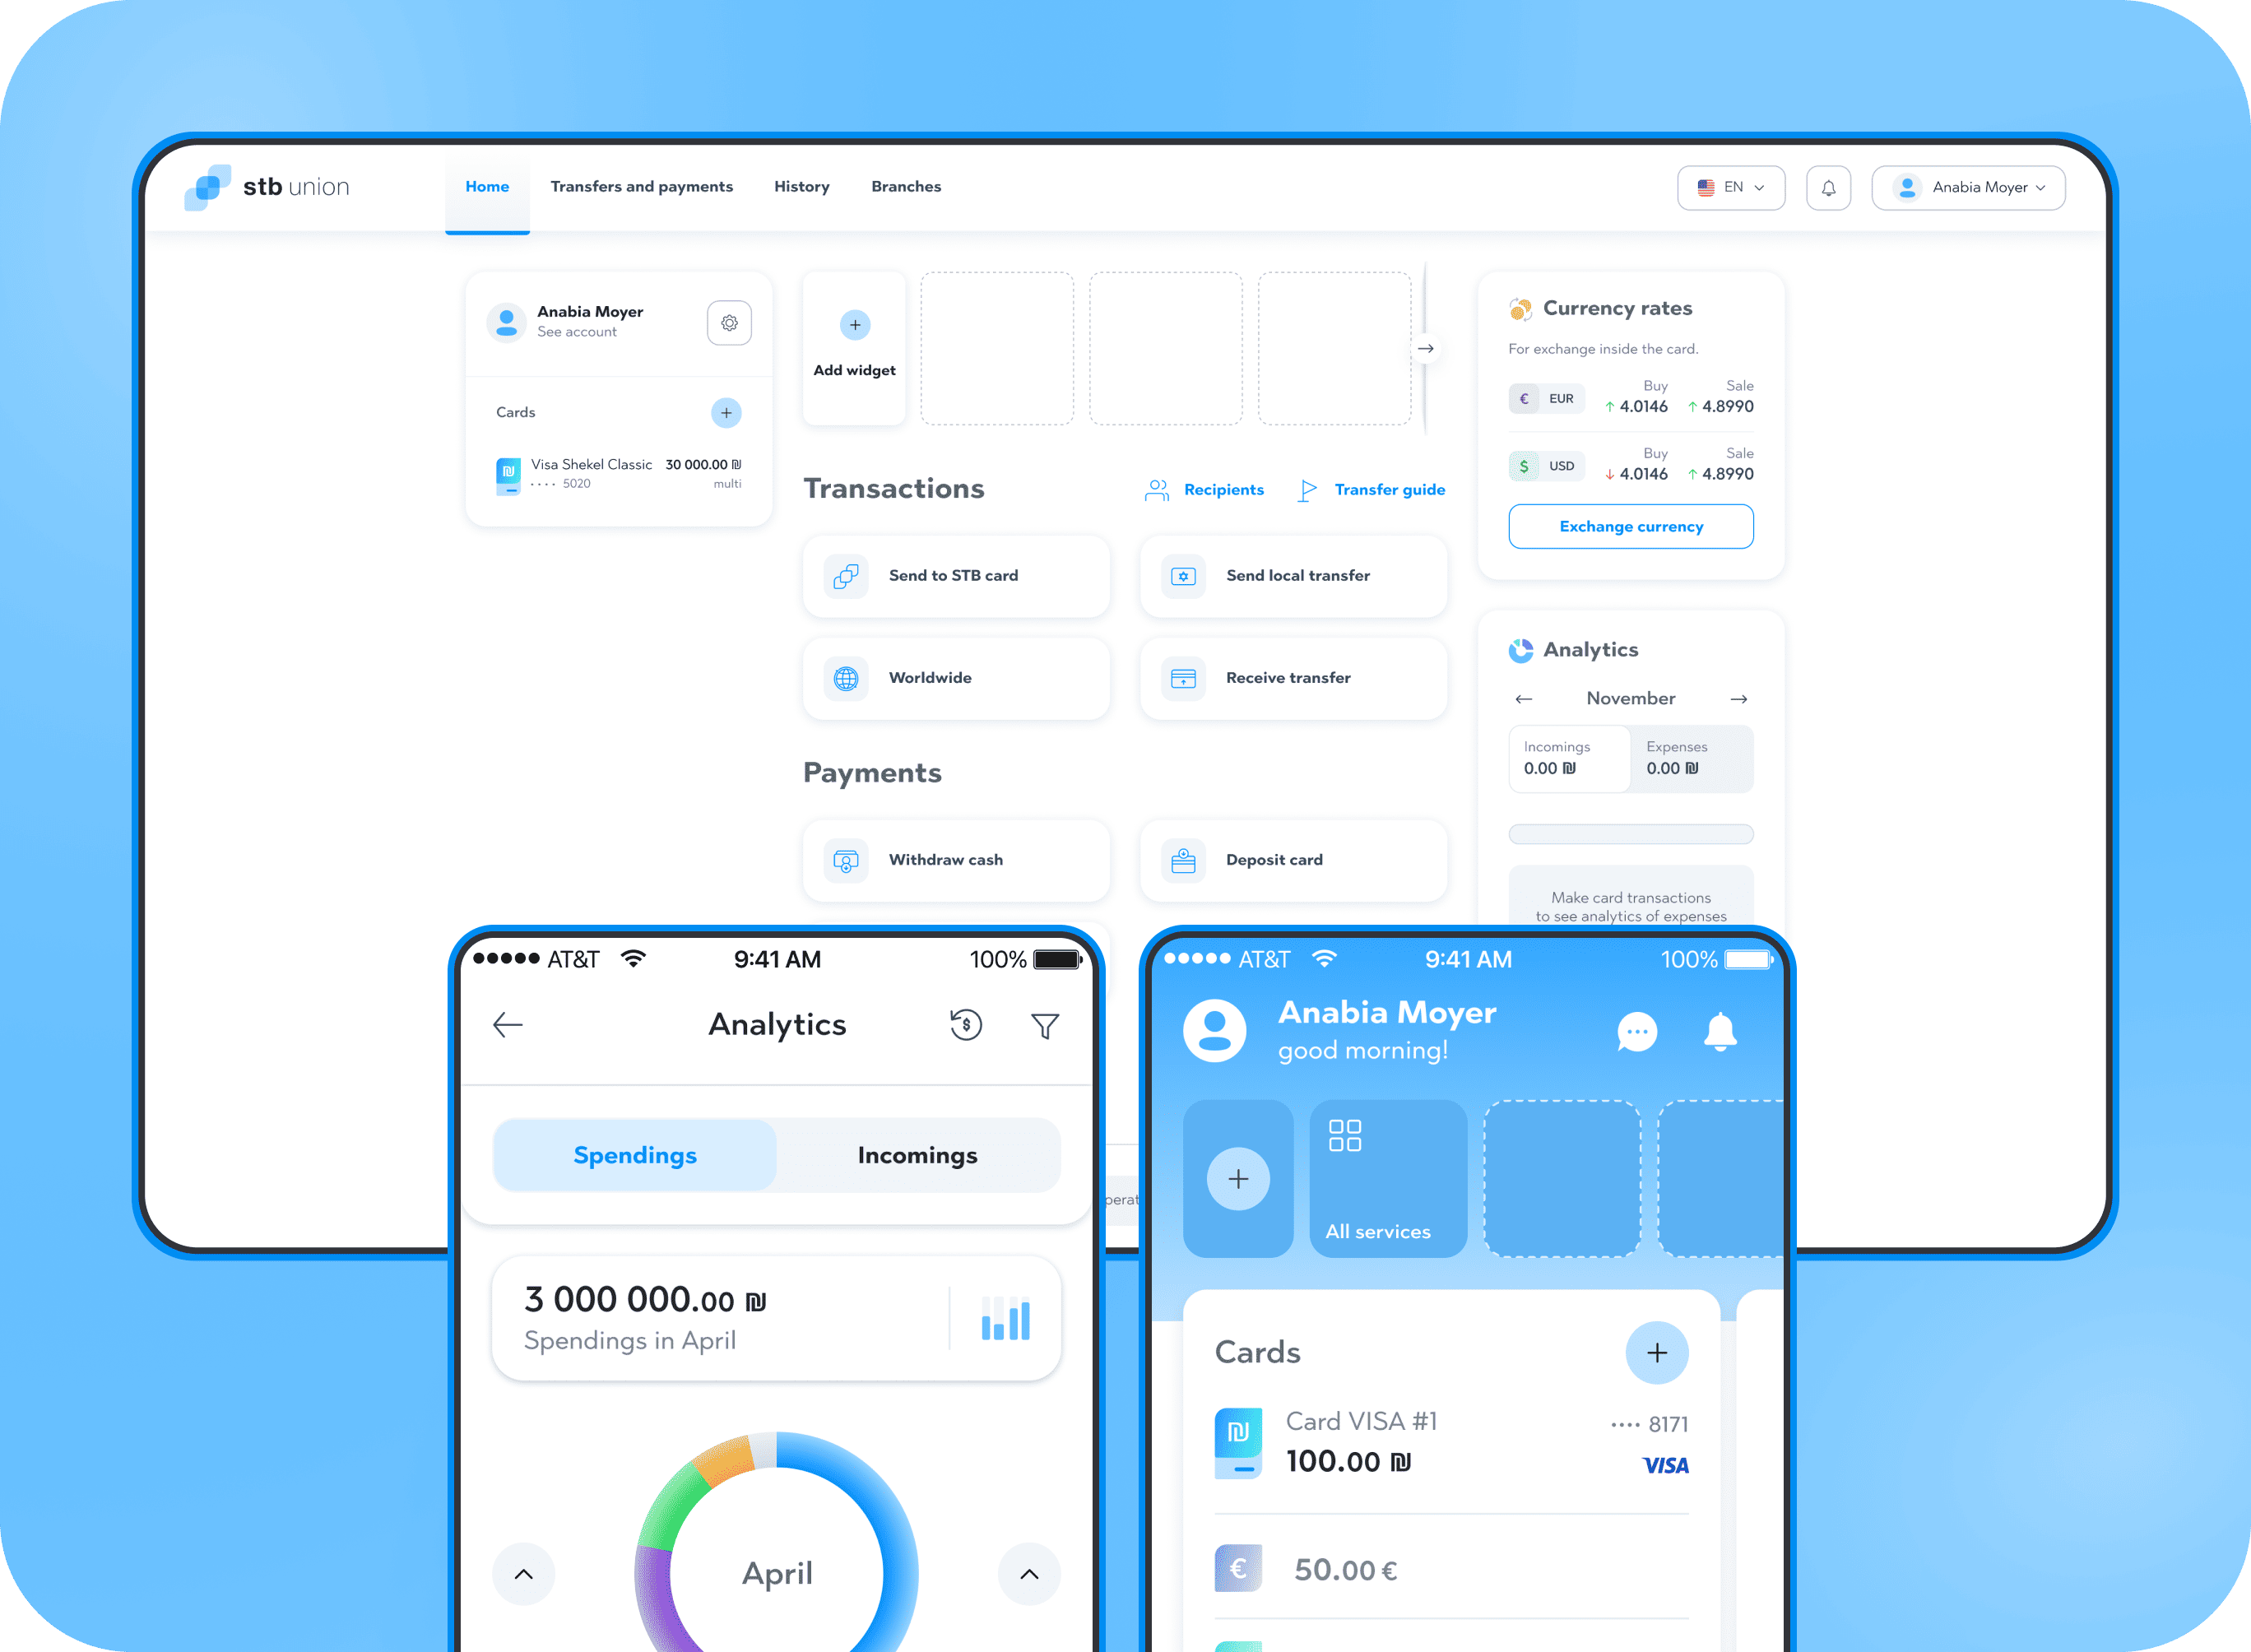
STB Union
STB Union, a major FinTech player, partnered with Yojji to evolve from a traditional currency exchange network into a modern financial marketplace. The project aimed to develop a secure, scalable platform for multi-currency wallets, international transfers, and digital card services, using React JS, React Native, and Java to enhance STB Union’s service offerings and strengthen its position in FinTech.
View