Key Product Management Metrics to Track

KPI, or Key Performance Indicators, sometimes referred to as KSI (Key Success Indicators), are performance metrics that measure the specific goals for businesses across all sectors. These indicators are one of the powerful tools at a product manager’s (PM) disposal that are used to measure the team’s success, the progress of the product, and the overall business growth. Product manager KSIs involve various activities, associated with product development, customer activity, marketing, and team efficiency. With the help of KPIs, product managers identify possible risks and celebrate success, so the absence of the necessary metrics leaves a PM blind to the current condition of the business, weaknesses, and gaps in the management style.
In this article, we will describe the metrics and KPIs to track the success of your product. Personal and team success depends on how well you interpret data, learn, hypothesize, and make the necessary changes to improve the efficiency of business processes.
KPIs and Metrics for Product Management
Metrics are a measure that is used by marketers, stakeholders, and product managers to track product and business success. Based on the data of these metrics, decisions are made on setting goals, solving current problems, implementing changes, as well as overcoming risks. How to measure KPIs? The most popular tool is web analytics. Google Analytics provides the ability to track a variety of data, including information about product performance, sales, and new users/subscribers.
Metrics to Forecast Business Success of a Product
These are financial indicators that are paramount for stakeholders, as they show the current financial position of the company and help forecast future revenue. These metrics determine the fate of the product and define the company’s development strategy.
Monthly Recurring Revenue (MRR)
What it is: This metric is used to measure monthly subscription income (this type of income is recurring).
How to use it: This is one of the fundamental KPIs for SaaS businesses that use the subscription revenue model. Using this indicator, it is possible to track the change in subscription revenue, analyze the overall health of the business, and also assess how the business is growing and developing.
Formula: MRR = MRR+GR - CR
MRR stands for the MRR at the beginning of the month, GR stands for monthly revenue gained from new subscriptions, and CR means churned revenue.
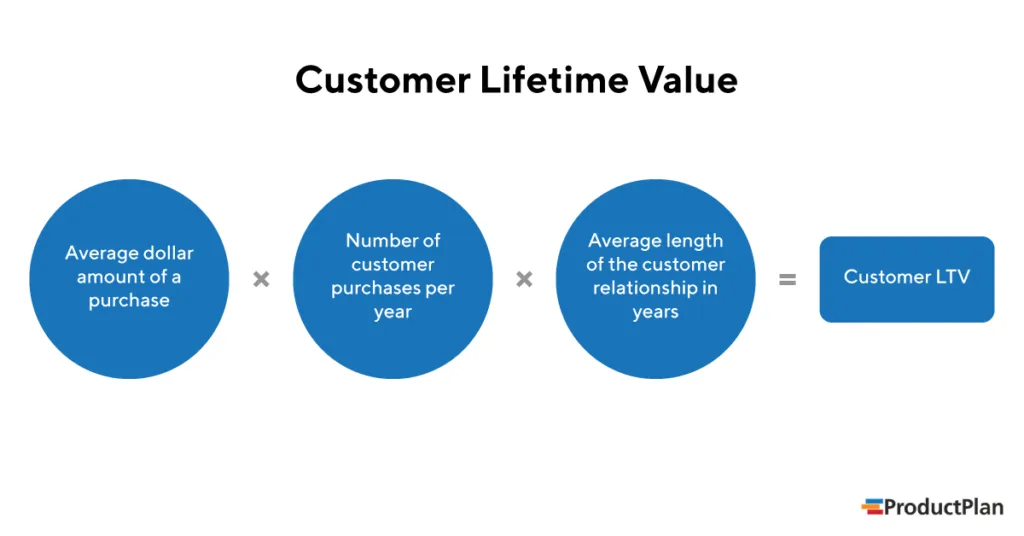
Customer Lifetime Value (CLTV or LTV)
What it is: Customer Lifetime Value, also called Lifetime Value, measures the full value of revenue from a customer over the entire time that they remain a customer.
How to use it: With insight into customer lifetime value, a business owner can analyze the rationale for using resources to attract customers, and make the right decisions for the company’s long-term growth and success. CLTV is affected by contract value, retention, churn, and upsell revenue. With the help of LTV, you can analyze every segment of the users. Based on this information, you can develop retention strategies and test the purchasing cycle.
Formula:
Customer Acquisition Cost (CAC)
What it is: This metric shows the cost of acquiring one customer. This cost includes marketing, advertising, and salary expenses of specialists from the marketing and sales department.
How to use it: Use this metric to analyze the value your customers bring to you and to calculate the cost of acquiring them. Depending on the results, you can make changes to your marketing and pricing strategy. Besides, you can enhance your product to create growth opportunities (e.g. Free trials) and convert lookers into bookers.
Formula: CAC=SMC / TNC
SMC stands for sales and marketing costs, and TNC means total new customers.
For example, let’s say you ran a Facebook ad, and spent $2000 on the design, building the landing page it leads to, and actually showing it to people. If that ad gained you 200 customers, that’s a CAC of $10.
Metrics to Analyze and Grow User Engagement
These metrics are also important because they show how effective the interaction between the user and the product is. You will be able to analyze the number of users of the product, the time of using the product or particular features, the reaction of users to the implementation of certain functions, as well as the reasons for not using the product.
Monthly Active Users (MAU) and Daily Active Users (DAU)
What it is: MAUs and DAUs give insight into the growth of your user base, engagement, and how well your digital product resonates with your consumers. Active user metrics are very useful for companies focused on long-term growth. These metrics show how many active and unique users your product attracts per week (WAU), per day (DAU), or per month (MAU). These active users should sign in to their accounts and perform certain valuable actions.
How to use it: These metrics are used to analyze the dynamics of the product (its growth or decline). For example, a DAU/MAU of 20% is considered a good indicator, while 50% means exceptional success. Based on this data, you plan your budget and decide on the development of new features.
Formula: MAU/DAU ratio= (DAU / MAU) * 100
Session Duration
What it is: This KPI is used to track user engagement. In simple terms, the session is the time between opening and closing an application. Usually, the higher this number, the better.
How to use it: This data is used to analyze the user interaction, reasons for not using the product, and find ways to increase the session time.
Formula: SD = TT / UN
TT signifies the total time clients spend using your product, and UN means the number of users.
Usually, Google Analytics calculates the session length.
Metrics to Keep Users Interested
These metrics help you understand if your marketing and customer support efforts are paying off.
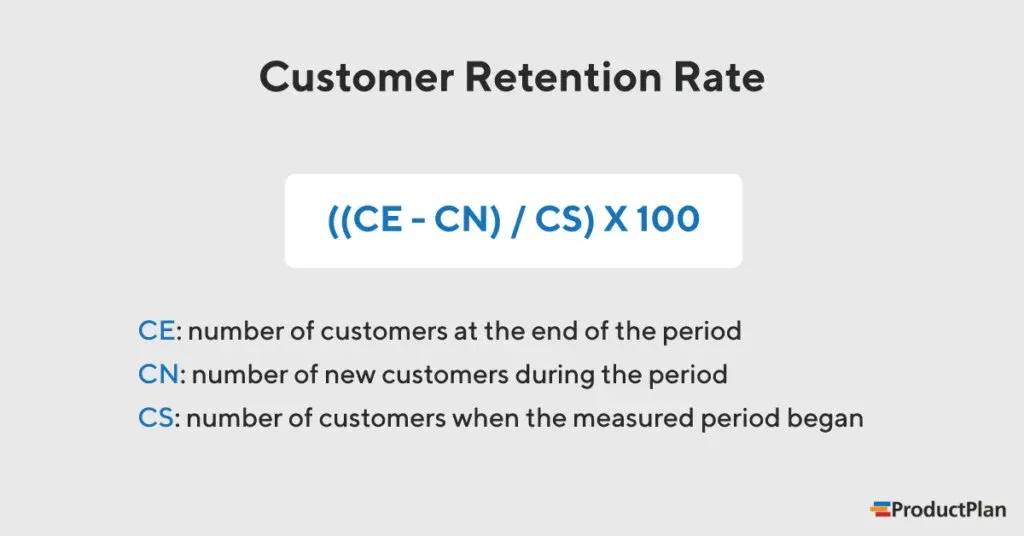
Retention Rate
What it is: Customer retention rate (CRR) indicates the percent of active customers who remained with a company for a certain period (month, year, etc.) Basically, the CRR shows if your product solves the users’ problems and remains relevant for them.
How to use it: According to research by Bain & Company, a 5% increase in customer retention generates more than a 25% boost in profit. Use this metric to predict customer lifetime value and understand retention dynamics. This indicator should grow, but if it decreases, then it is necessary to detect the problem (new competitors, poor customer service, etc.) and eliminate it.
Formula:
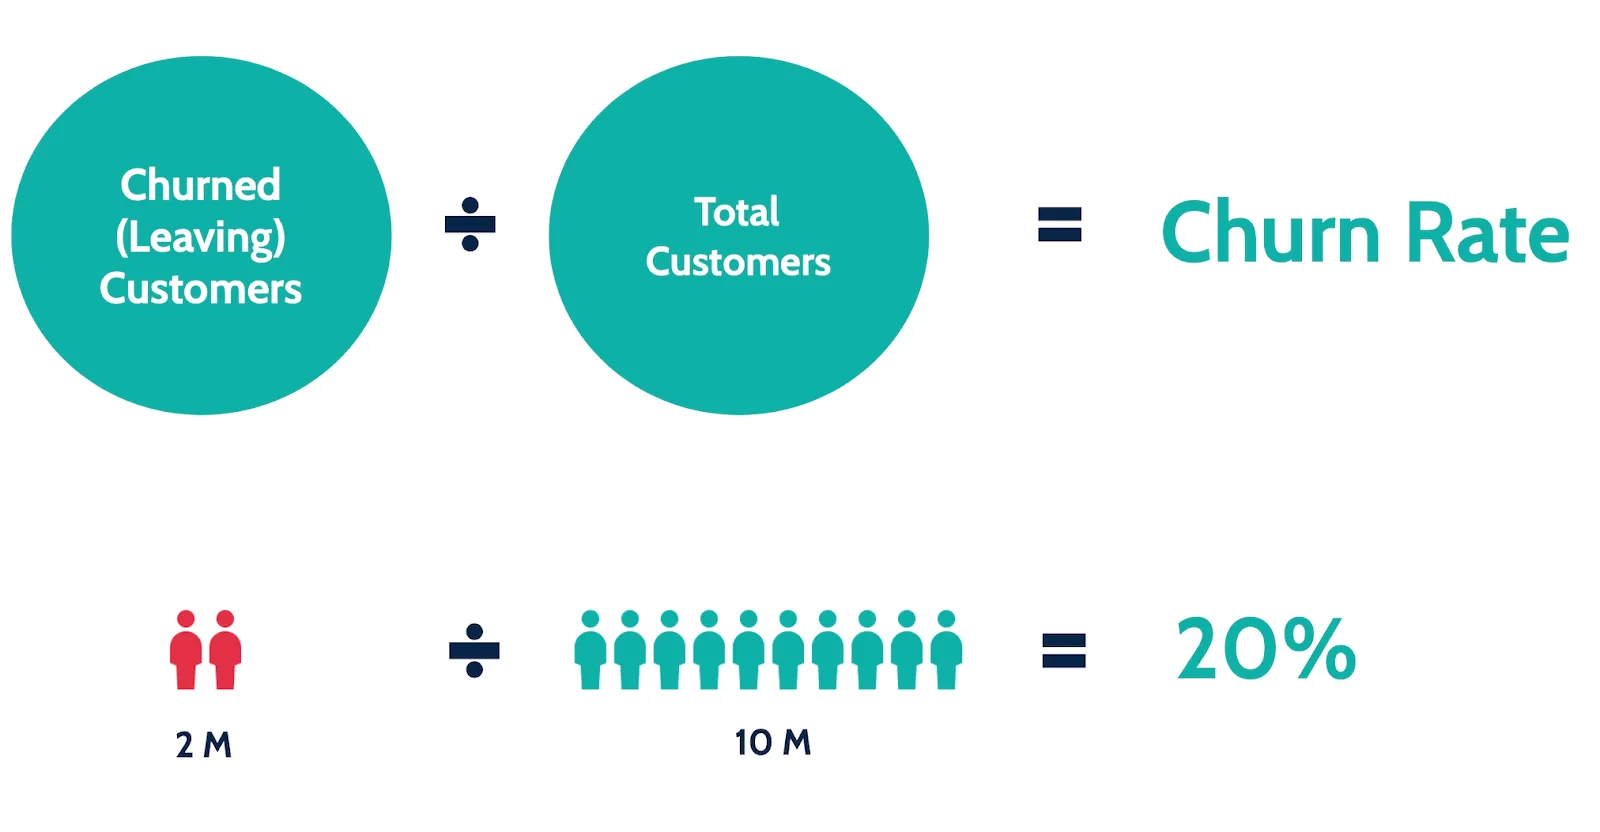
Churn Rate
What it is: It shows the percentage of clients who stopped using your product.
How to use it: Use it to measure customer satisfaction. If this percentage is low, it indicates that you have a loyal audience, and your product has a steady growth. Usually, this metric is analyzed after new features or subscription plans are introduced.
Formula:
Bottom Line
So, the information provided gives you an idea of what important KPIs are and how to calculate the most important metrics to ensure customer satisfaction and revenue growth. Using these data, you can analyze current business health and elaborate a product-led growth strategy. If you need professional help, Yojji professionals with the necessary expertise and experience are here to assist you. Contact us if you have any questions.
Let’s work together
Yojji successfully delivered the project within schedule. They demonstrated excellent project management via weekly sprint demos and promptly made adjustments based on the client's feedback. Their responsiveness and collaborative attitude were key elements of their work.

5.0

Yojji was an instrumental part of the client’s team, working closely with them to achieve the product’s success. The team was very collaborative and timely, and their performance was amazing. Additionally, their resources were experienced, professional, and enjoyable to work with.

5.0
Yojii is impressive both in quality of development work as well as their commitment. Strong focus on delivery, highly technical personnel, flexible approach that allows for rapid development. Strong processes that allow for solid controls.

5.0
We’re very happy with the way that Yojji works, which is why we’ve spent so much money and engaged them for such a long time. We treat them as employees in regard to responsibilities and expectations, and they haven’t disappointed us.

5.0
As a company, we find Yojji to be excellent development partners - we cannot recommend them more highly and will be very happy to continue working with them in the future.

5.0
They are really nice people with excellent technical backgrounds.

5.0
We used Agile project management methodology and were in contact with the team and project manager daily.

5.0
They all had a super positive outlook and were dedicated to getting the work completed to a high standard.

5.0
Yojji has delivered an accessible product with thorough consideration for the client's requirements. Users have commented on the platform's user-friendliness and speed. Moreover, the team is easy to communicate with and provides frequent updates. Their development and design skills are impressive.

5.0